Bitcoin’s (BTC) drop below $8,000 yesterday may have tempered the positive mood in the market, but the broader outlook still remains bullish, technical charts indicate.
The overnight drop in price came soon after the Securities and Exchange Commission’s (SEC) second rejection of the Winklevoss brothers’ application for a bitcoin ETF.
While the decision may have soured the sentiment in the market, the price pullback was also likely a function of overbought conditions. Notably, the short-duration price chart had warned of a dip below $8,000 yesterday.
At press time, the world’s largest cryptocurrency by market capitalization is trading at $7,965 on Bitfinex, having clocked a three-day low of $7,848 earlier today.
It is worth noting that BTC is still up 40 percent from the June 24 low of $5,755, despite the pullback from the two-month highs above $8,500. Thus, it is safe to say the bull market is intact.
4-hour chart
The bearish divergence of the relative strength index (RSI) seen in the above chart may have helped trigger a correction in prices.
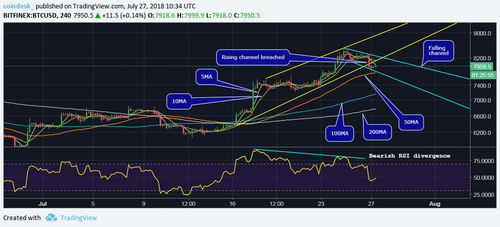
The drop saw the cryptocurrency beaching the rising channel yesterday, neutralizing the immediate bullish outlook and also establishing a lower highs and lower lows pattern (bearish setup).
That said, the path of least resistance remains to the upside as the 50-candle, 100-candle, and 200-candle moving averages (MAs) are rising and located one above the other.
The pullback has also allowed the RSI to position itself in a more bull-positive way, meaning it is no longer reporting overbought conditions.
Daily chart
Investors may feel tempted to question the validity of the long-term bullish breakout discussed yesterday as BTC has fallen back into a descending channel.

However, asset prices tend to revisit key support levels (former resistance levels) immediately after a long-term bullish breakout due to overbought conditions. This is widely referred to as a «crowding out of weak hands» (that is, bulls with low-risk appetite) before a bigger rally.
Hence, a long-term bullish breakout remains on the cards and would be confirmed if BTC makes a weekly close (as per UTC) above $8,050 (falling channel resistance) on Sunday.
Meanwhile, BTC retains a short-term bullish outlook, as the 5-day and 10-day MAs continue to rise in favor of the bulls. What’s more, BTC is also trading well above the 50-day MA and 100-day MA hurdle.
View
- The short-term outlook remains bullish, despite the overnight correction in BTC prices.
- The 200-day moving average hurdle of $8,557 could be put to test over the weekend if prices find acceptance above $8,000 in the next 24 hours.
- On the downside, only a daily close below the rising 10-day MA of $7,718 would abort the short-term bullish view.