Latest Ethereum News. The evolution of Ethereum as a decentralized and open source platform to an efficient world computer capable of securely storing and processing information requires sacrifice and participation from all stake holders. At the back of this is the need to address scalability and of course deal with centralization possibilities via ProgPow. Ethereum 2.0 or Serenity is where the platform is trudging to as network users defer on how best to progress.
While Ropsten was unsuccessful forcing the team to postpone Constantinople test-net launch, a tentative date Jan 16, 2019 has been set. It shall remain so but still developers could postpone launch until after there is guarantee of smooth transition.
Remember, the objective is to ensure that Serenity-or Ethereum 2.0 would be backward compatible with Ethereum 1.0. This delay is simply because developers are trying to integrate scalability options into the legacy chain.
In all these, it will be a step-by-step procedure before Serenity and shift to PoS is live. First, assuming everything goes on as planned, then we expect to see Beacon Chain implementation in Q1. Thereafter we shall see Sharding by 2020 and later Ethereum 2.0 activation. Serenity guarantees scalability-upwards of 1000X complete with synchronous affirmations averaging 10 seconds.
ETH/USD Price Analysis
Thing is, traders are struggling to turn in a profit.
Gains are tight and though ETH/USD pair is up 0.4 percent in the last week, it is down the same margin in the last day indicative of a ranging market.
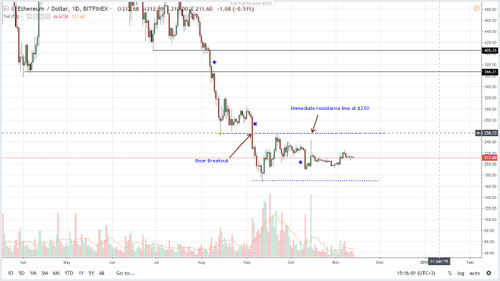
Like in our previous ETH/USD trade plans, Ethereum is moving within a tight consolidation and struggling against sellers who have so far been successful at confining prices within a $30 trade range.
Trend: Bearish
Our trade position finds good support from Sep 5 bar. Not only is the bar printing in a bleeding market but it is wide and accompanied by high trade volumes.
Therefore, considering it broke below previous support now resistance at $250, the subsequent price accumulation and the failure of prices to edge past that liquidation level hint of bears.
Everything else constant, it will be ideal if ETH/USD buyers build momentum to drive prices past $250-$300. However, this seems unlikely from candlestick arrangement.
Trading Volumes: Flat but low
Before Sep 5 breakout bar, average volumes stood at around 200k. With Sep 5 printing 544k and closing below $300 complete with wide trade ranges, bears were in charge. Since then conspicuous candlesticks with high volumes are Sep 17-968k (bearish) and Oct 15-964k (bullish).
Nonetheless, these bars are still moving inside a $110 trade range with supports at $160. For bear breakout bar confirmation then we need to see a high-volume bar print below $160.
On the reverse side, the bull breakout bar should be at the back of strong volumes exceeding the last 10-day average of 130k.
Candlestick Formation: Bear Break Out and Ranging
As aforementioned, ETH/USD is trading within a bear breakout pattern with clear supports at $160 and $300. Unless this accumulation/distribution lead to gains above $250–$300 resistance or declines below $160, bears are in charge but traders should take a neutral stand.
Conclusion
Fundamentals are supportive of price and with Constantinople activation, network users would be one step up towards enjoying a scalable network and unrivaled transaction speeds. In the meantime, we should see that optimism translate to price. From the chart it is clear that ETH/USD is range bound and unless there are trend defining breakouts, we suggest taking a neutral stand.

