Latest Ethereum Price News. That governments are bullish on blockchain technology is true. In fact, we have seen several forward-thinking agencies in progressive states like Singapore and Austria making use of DLT technology at some point. Now, people familiar with state developments claim the Economic Development and Trade Ministry of Ukraine is serious about legalizing cryptocurrencies and similar activities including coin offerings (ICOs).
To this end, the state plans to introduce and implement favorable policy that shall promote the development of blockchain and cryptocurrency activities at a legislative level. In a two-phase implementation strategy that will conclude by 2022, Ukraine shall by then eliminate uncertainty, paving way for blockchain businesses to execute their objectives under “understandable conditions”.
This progress seems to confirm Alexei Mushak’s Facebook post hinting of their intention to formulate fair laws that spur mass adoption while curbing criminal activities.
Should this be the case then Joseph Lubin’s comments about digital assets not being on the edge is true. While speaking to CNBC, Joseph-who doubles up as the co-founder of Ethereum and founder of ConsenSys, remain upbeat about the potential of Ethereum and similar DLTs. He points to a surge in blockchain projects and cyclic “boom and bust” which tempers the market.
This is huge. Austria will be using the Ethereum blockchain to auction off over $1.3B in government bonds. These are the type of things we need for mainstream adoption.
– Altcoin Thoreau (@cvrbonbased) September 28, 2018
Ethereum (ETH/USD) Price Analysis
Despite upbeat projection, ETH/USD is simply fading the herd as prices dip below psychological tags. In the last week and day, Ethereum price is down 3.5 percent and 1.1 percent respectively as price action dash expectations.
Trend: Bearish
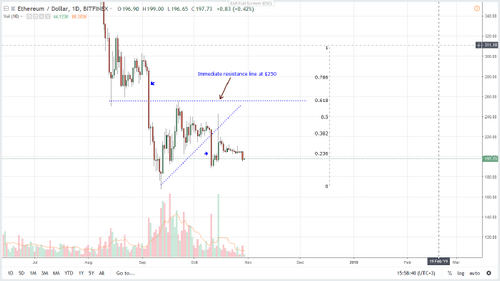
After 14 days of horizontal consolidation ETH/USD broke lower. But, that appears to have been the path of least resistance. A simple trend line connecting recent highs is negative sloping. Apart from this, there are other bear pointers. Note that in last two months, Aug 7-8, Sep 5 and Oct 11 bars stand out. All of them have strong volumes and wide trading ranges fueling more draw downs.
Volumes: Decreasing
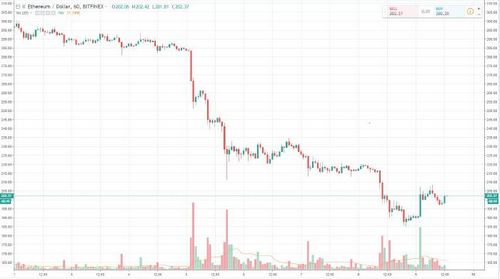
Though sellers seem to be in charge, Oct 15 volumes are very high-at 967k. It’s even higher than those of Oct 11-at 657k. Between Oct 16 to 29, average volumes stood at around 55K only shooting to 172k yesterday as ETH/USD print lower. From this, it’s clear that Oct 15 high low is anchors our analysis.
Candlestick Formation: Bear Breakout Pattern
Technically, the events of the first two weeks of Sep defines recent price action. On Sep 5, ETH/USD broke below $250 in a bear break out pattern. Since then ETH/USD prices have been oscillating within the tight $120 range between $250 caps and $160 support. While traders remain upbeat, bulls could only be confirmed if there were solid moves above $250 previous support now resistance. That didn’t print either.
Conclusion
Simply put, ETH/USD is trending at a precarious position in a market that is largely ranging between $250 and $160. Volumes are low and candlestick formation point lower. Because of this, it’s safe to take a neutral stand as we wait for solid, high volume losses below $190 confirming Oct 11 bears. From there, traders can take small position sells. Additionally, conservative traders should wait for conclusive break outs below $160 or Sep lows. If ETH/USD pair slide below this then first targets is $75. On the reverse, surges above $250 shall be market reviving.